
Introduction
Clean and healthy rivers and streams enhance the quality of our lives. They supply our drinking water, irrigate our crops, provide highways for shipping, and offer us recreation. They support aquatic life and provide shelter, food, and habitat for birds and wildlife. Rivers and streams shape America’s landscape. They are the land’s vast, interconnected circulatory system, carrying water from the mountains to the sea.
The National Rivers and Streams Assessment (NRSA) is an EPA, state, and tribal partnership to assess the condition of rivers and streams across the U.S. (see report acknowledgments for a list of partners). The National Rivers and Streams Assessment: The Third Collaborative Survey presents the results of the 2018-19 survey of perennial rivers and streams in the conterminous United States. The first survey took place in 2008-09, with the second in 2013-14. A pilot study of streams (the Wadeable Streams Assessment) was conducted between 2000 and 2004.
During spring and summer of 2018 and 2019, 61 field crews sampled 1,851 sites, using standardized sampling procedures to collect data on biological, chemical, physical, and human health indicators. The measured values were compared to benchmarks developed specifically for NRSA, to EPA recommended water quality criteria, or to EPA fish tissue screening levels to assess river and stream condition.
The NRSA is designed to answer the following questions about rivers and streams across the United States:
- What percentage of rivers and streams support healthy ecological communities and recreation?
- What are the most common problems?
- Are conditions improving or getting worse?
- Are investments in water quality focused appropriately?
The NRSA is one of four statistical surveys that make up the National Aquatic Resource Surveys (NARS) program, the first program to assess the condition of all waters nationally over time. The NRSA can help stakeholders plan for the protection and restoration of rivers and streams across the United States. For more information, see the NARS history web page.
In addition to examining the health of rivers and streams on a national scale, the NRSA is designed to provide statistically valid results on the condition of broad regions and other subpopulations.
This report focuses on results at the national scale, comparing the 2018-19 condition of perennial rivers and streams to that from the earlier NRSA studies. Regional highlights are also provided.
The report also summarizes results for an additional study of rivers conducted during NRSA 2018-19 for the fish tissue contaminants mercury, polychlorinated biphenyls (PCBs), and per- and polyfluoroalkyl substances (PFAS) (with a focus on perfluorooctane sulfonate (PFOS)). (See Fish Tissue Contamination in Rivers below.) Detailed results are available on EPA’s fish tissue study page.

Penns Creek, Centre County, Pennsylvania. EPA.
Results from the NRSA can help us better understand the condition of rivers and streams in the United States, some of the stressors affecting them, and how stressors relate to local conditions. While this report analyzes associations between biological indicators and stressors, it does not establish a cause-and-effect relationship between them. This report describes changes in condition from 2008-09 to 2018-19; data from future assessments will help determine whether these changes represent a trend or are the result of natural variability.
KEY FINDINGS ON 2018-19 CONDITION
Following standard practices (described in the Assessment Benchmarks, Criteria, and Screening Levels section), EPA analysts classified results for most indicators as good, fair, or poor. For a few indicators, the results instead show whether chemicals were detected or whether values exceeded a benchmark, criterion, or screening level.
Many of the measures included in the NRSA are natural components of river and stream ecosystems. For example, some level of nutrients like phosphorus is necessary to support stream communities such as fish, and algal toxins like microcystins occur naturally. At elevated levels, however, these substances can cause harm to biological communities or human health.
Healthy habitat occurred in over half of our river and stream miles.
- Physical habitat indicator scores revealed that 68% of river and stream miles were rated good for in-stream fish habitat, 57% scored good for streambed sediment levels, and 56% of river and stream miles had good ratings for riparian vegetation (vegetation on or adjacent to the river or stream banks).
- However, 64% of river and stream miles had moderate or high levels of riparian disturbance.
Less than one-third of our river and stream miles (28%) had healthy biological communities, based on an analysis of benthic macroinvertebrate communities.
- Biological condition was based on the abundance and diversity of benthic macroinvertebrates (bottom-dwelling invertebrates such as dragonfly and stonefly larvae, snails, worms, and beetles).
- Close to half of river and stream miles (47%) were in poor condition.
Just over one-third (35%) of river and stream miles had healthy fish communities.
- Fish community health was based on fish abundance and diversity.
- Sixteen percent of river and stream miles were not assessed for fish. The remainder (49%) were in fair or poor condition.
Nutrients (phosphorus and nitrogen) were the most widespread stressors.
- Forty-two percent of the nation’s river and stream miles were in poor condition, with elevated levels of phosphorus, and 44% were in poor condition for nitrogen.
- Poor biological condition was more likely when rivers and streams were in poor condition for nutrients.
Reducing nutrient pollution could improve biological condition.
- NRSA analyses indicated that approximately 20% of the river and stream miles in poor biological condition could be improved if nutrient condition changed from poor to fair or good. The level of improvement was estimated to be similar regardless of nutrient and biological indicator analyzed.

Field crew members measuring physical stream characteristics. EPA.
Bacteria exceeded EPA’s recreational benchmark in 20% of river and stream miles.
- Enterococci, bacteria that indicate fecal contamination, were above EPA’s benchmark in 20% of river and stream miles.
- Swimming and recreating in water contaminated with pathogens could make people ill.
Algal toxins were present, but at very low levels, with minimal recreational human health concerns.
- Microcystins and cylindrospermopsin were detected in 9% and 10% of river and stream miles, respectively, but did not exceed EPA recommended criteria in any samples.
Contaminants were present in all fish tissue, but risk varied by contaminant and fish consumption levels. In samples composed of fillet tissue from multiple fish, concentrations exceeded screening levels as follows (as a percentage of the 41,099 river miles comprising the sampled population):
- Mercury: 26%.
- Total PCBs: 45% for general fish consumers, 74% for high-frequency fish consumers.
- PFOS: at least 92% (see the fish tissue section for details).

Field crew member entering observations into a tablet. University of Houston-Clear Lake.
KEY FINDINGS ON CHANGES FROM 2013-14 TO 2018-19
For the benthic macroinvertebrate community indicator, little changed between surveys nationally.
For fish community, there were statistically significant changes in condition.
- River and stream miles in good condition increased from 25% to 35%.
Significant changes occurred for some physical habitat measures.
- The percentage of river and stream miles in good condition increased for riparian disturbance by 9 percentage points between 2013-14 and 2018-19.
- The percentage of river and stream miles in good condition also increased for streambed sediments by 6 percentage points.
- For in-stream fish habitat, the percentage in poor condition decreased by 4 percentage points.
Two human health indicators showed improvement.
- There was a significant decrease (13 percentage points) in river and stream miles exceeding EPA’s benchmark for enterococci in recreational waters.
- There was also a significant decrease (as much as 7 percentage points) in river miles containing fish that exceeded EPA’s screening level for PFOS (see the fish tissue section for details).
For most water chemistry parameters (except phosphorus), there was little change between surveys at the national level.
- Phosphorus showed a significant increase in river and stream miles in good condition (16 percentage points) and a significant decrease in river and stream miles in poor condition (18 percentage points).
NRSA DASHBOARD
EPA has developed an interactive dashboard to accompany this report. It contains full regional results and allows comparisons between different subpopulations of rivers and streams (e.g., EPA regions and river basins).
Users can also get to the dashboard by following the link at the bottom of each graph in this report. Those links will bring users to a customized page with regional data for each indicator. Users can then navigate to other dashboard views using the "Condition Estimate" dropdown and other dashboard controls.
HOW CAN I FIND OUT MORE?
Read the other sections of this report for more detail on the results for each indicator, including data from 2008-09. Explore the interactive dashboard to compare national and regional conditions. See the NRSA 2018-19 Technical Support Document (U.S. EPA 2024a) for technical details on the survey design and data analyses that underpin the findings in this report. Additional information on the NRSA and the previous reports is available on EPA’s NRSA home page. Readers may want to visit the main NARS website periodically to view additional products using the science and data from the assessments, such as published scientific research and results for other surveys in the NARS program.
Background

Eastern dobsonfly (Corydalus cornutus), a type of benthic macroinvertebrate. connor_elliot. iNaturalist, CC BY-NC 4.0. Cropped.
This section provides a brief background on the survey methodology. For details on survey design, field methods, and quality assurance plans, see EPA’s NARS manuals page. For additional details on the NRSA survey design, see EPA’s design documents page.
CHOOSING INDICATORS
EPA used 16 indicators to assess the biological, chemical, and physical condition of rivers and streams, as well as characteristics that pose risks to human health. Although there are others that could be used to describe river and stream condition, EPA has determined that these indicators align with the survey goals described earlier and are representative at a national scale. The NRSA also included collection of some data, such as periphyton (microscopic organisms such as algae and bacteria), for research purposes. Results for research indicators are not included in this report but will be posted on the NRSA website as they become available. For this report, EPA grouped indicators into four categories.
The survey included two biological indicators:
There were four chemical indicators:
EPA measured four physical indicators:
Lastly, the survey tracked six human health indicators:
SELECTING RIVERS AND STREAMS
EPA used a statistical sampling approach to select river and stream sites for this assessment, to ensure that survey results were unbiased. For more information on statistical surveys, see What Are Probability Surveys? and Selecting a Sampling Design. The target population for the NRSA was the set of rivers and streams in the conterminous U.S. meeting the definition in the box below.
How Were Rivers and Streams Defined for This Survey?
The target population of the survey includes all perennial streams and rivers, from the smallest headwater streams to the largest rivers, including those that are tidally influenced but still freshwater.
Tidally influenced rivers and streams with salinity of 0.5 parts per thousand or more are considered estuaries and are addressed in the National Coastal Condition Assessment. Very slow-moving segments of rivers created by dams, with a residence time greater than seven days, were excluded from the NRSA because they are more like lakes. These systems are included in the National Lakes Assessment.
The 1,851 river and stream sites were identified using a stratified random sampling design. This approach is also used in other environmental, social science, and health fields to determine the status of populations, whether ecological, human, or other. Using this method, rivers and streams are categorized into groups (for instance, by size or location), and every river and stream in the target population has a known probability of being selected for sampling. The NRSA 2018-19 design was stratified by state, stream order (stream size), and broad ecoregions to ensure adequate geographic distribution of sites.
The statistical design of the survey allows EPA to extrapolate the results from the 1,851 river and stream sites sampled to the approximately 1,543,290 river and stream miles meeting the definition in the box above. For example, if the condition is described as poor for 10% of river and stream miles nationally, this means that the number of miles estimated to be degraded for that indicator is 154,329.
To produce the results for each indicator, EPA assigned each randomly selected site a weight based upon the total number of miles that the site represented. This enabled EPA to estimate the proportion of all miles in each condition category (e.g., good, fair, or poor). See the appendix and technical support document for details.
When designing the survey, EPA considered the number of river and stream sites that should be sampled. The greater the number of sites sampled, the more confidence in the results. The 1,851 sites sampled in NRSA 2018-19 allow EPA to determine the percentage of miles in each condition category within a margin of error of ±5%, with 95% confidence at the national scale. See Exhibit 1 for a map of the 2018-19 sampling sites and their distribution across ecoregions.
Map of NRSA 2018-19 Sampling Sites in Each Ecoregion

FIELD SAMPLING

Field crew members electrofishing to collect fish for fish community and fish tissue analyses. EPA.
To ensure consistency in collection procedures and to assure the quality of resulting data, field crews participated in training, used standardized field methods, and followed strict quality control protocols (visit NRSA manuals for details, including diagrams of sampling locations at each site).
Field protocols used in NRSA were designed to collect data relevant to biological condition and key stressors. A three- or four-person field crew spent a full day sampling each site under normal flow conditions. Crews measured out and marked the stretch of river or stream to be sampled and 11 transects to guide data collection (see EPA’s Rivers and Streams Field Methods for more on sampling). At each site, crews collected water and fish tissue samples for chemical analysis, collected macroinvertebrate samples, and identified fish species found at the site. Crews also recorded visual observations, including data on the characteristics of each stream and the riparian area.
ASSESSMENT BENCHMARKS, CRITERIA, AND SCREENING LEVELS
NRSA analysts reviewed the raw data for each indicator independently and assigned the values in each dataset to categories (for example, "above criterion" or "at or below criterion"; good, fair, or poor). To assign the appropriate condition category, EPA used two broad types of assessment benchmarks for NRSA 2018-19.
The first type consisted of fixed benchmarks applied nationally based on values in the peer-reviewed scientific literature, EPA published values, or EPA-derived screening levels. For example, EPA’s recommended water quality criteria were used nationally to classify rivers and streams as above or below a criterion or benchmark for microcystins, cylindrospermopsin, enterococci, and mercury. Similarly, EPA fish tissue screening levels, developed using information on human health risk and fish consumption rates, were applied for PCBs and PFOS.
The second type consisted of NRSA-specific ecoregional benchmarks based on the distribution of indicator values from a set of river and stream reference sites. EPA chose this regional benchmark approach because river and stream characteristics in different ecoregions vary due to climate, geology, and ecology, as well as human disturbance. Numerous scientific studies described in the technical support document, as well as peer reviews of other NRSA and NARS documents, support the use of regional benchmarks to evaluate the condition of rivers and streams and other types of waters.
The technical support document provides indicator-specific details about benchmarks, criteria, and screening levels, and it describes reference site selection (U.S. EPA 2024a).
The steps below describe EPA’s process for setting regional benchmarks and determining condition. Exhibits 2-5 provide an example of how the total nitrogen benchmark was derived for the Coastal Plains ecoregion. The process for other indicators and ecoregions was similar, resulting in regionally relevant benchmarks for each of the other ecoregions assessed. EPA developed these benchmarks during earlier NRSA surveys. For NRSA 2018-19, EPA reviewed the new data to see if recalculation would improve the statistical robustness of the benchmarks but ultimately determined that revisions to the benchmarks were unnecessary.
1. Screen River and Stream Sites to Identify Reference Sites. First, EPA analysts evaluated information from the randomly selected rivers and streams and a smaller set of hand-picked sites thought to have low levels of human disturbance. EPA scientists evaluated these sites by considering reference screening factors such as chloride and sulfate concentrations and land use data. Rivers and streams that passed screening were considered less disturbed than others and were used in establishing the reference distribution. Exhibit 2 shows a map of reference sites in the Coastal Plains ecoregion.
Reference Sites in the Coastal Plains Ecoregion

In the exhibit below, each dot indicates the observed nitrogen level (in parts per million, or ppm) at one of the reference sites. Many of the dots overlap because they have similar values.
Nitrogen Values at Coastal Plains Reference Sites

2. Calculate Condition Benchmarks Using Reference Data. EPA then used the 75th and 95th percentiles of the reference site distribution for nitrogen to set the benchmarks for the condition categories (see the exhibit below).
Nitrogen Condition Benchmarks in the Coastal Plains Ecoregion

3. Assign Condition Categories to River and Stream Sites. Using those regional benchmarks, EPA assigned the nitrogen condition (good/fair/poor) to each of the sites that were randomly sampled as part of NRSA 2018-19. As an example, the exhibit below shows the nitrogen value for each river or stream sampled in the Coastal Plains ecoregion and the condition category in which it (and the site) falls.
Nitrogen Values at Coastal Plains Sites Randomly Sampled as Part of the NRSA

The NRSA assessment benchmarks have no legal effect and are not equivalent to individual state water quality standards. NRSA condition categories also may not correspond to the categories states and tribes use when they assess water quality relative to their specific water quality standards under the Clean Water Act. For example, a rating of poor condition under NRSA does not necessarily mean a site is "impaired" as defined by state and tribal water quality standards assessment protocols. For additional information on state-specific and local water quality data and assessments, visit EPA’s How’s My Waterway application. To learn more about water quality standards, visit the EPA’s Water Quality Standards Academy.
National Results for Biological, Chemical, and Physical Indicators
This chapter presents information on each of the biological, chemical, and physical NRSA indicators. Each indicator section contains three parts: a brief explanation of why the indicator matters, results from the 2018-19 survey, and changes in condition. To download raw data from the survey, visit EPA’s NARS data page. Note that the results reported here for 2008-09 and 2013-14 will differ from those reported in the previous reports due to statistical adjustments that allowed EPA to present results for the full target population (see the appendix). All comparisons between earlier NRSA reports and NRSA 2018-19 should be made using the new information presented in the 2018-19 report and dashboard.
The graphs below show the estimated proportion of river and stream miles in each condition class, as well as the proportion of miles not assessed (for instance, if fish were not caught). Each estimate is accompanied by a 95% confidence interval (shown by the thin line at the end of each bar) that conveys the level of certainty in the estimate. The technical support document (U.S. EPA 2024a) explains the underlying assumptions and analysis.
The graphs present national data, but each graph contains a customized link to ecoregional data in the dashboard. Additional ecoregional highlights are included in the text for many indicators. Visit EPA’s NARS ecoregions page for maps and characteristics of each ecoregion.
BIOLOGICAL INDICATORS
The biology of a water body (the biological condition) can be characterized by the presence, number, and diversity of macroinvertebrates, fish, and other organisms. Together, they provide information about the health and productivity of the ecosystem. EPA chose both benthic macroinvertebrates and fish as indicators because they are sensitive to human-caused disturbances and can have different sensitivities to the same stressor. Assessing multiple communities provides a more complete assessment of biological condition.
Benthic Macroinvertebrate Community

Insect larvae such as this net-spinning caddisfly spend most of their lives on river and stream bottoms, emerging only as they become adults. Emilio Concari. iNaturalist, CC BY-NC 4.0.
Benthic macroinvertebrates include aquatic insect larvae and nymphs, small aquatic mollusks, crustaceans such as crayfish, aquatic worms, and leeches. They live among the rocks, sediments, and vegetation at the river or stream floor. These organisms were selected as indicators of biological condition because they spend most or all of their lives in water and their community structure responds to human disturbance. Given their broad geographic distribution, abundance, and food web connections, they serve as good indicators of the biological quality of rivers and streams.
The benthic macroinvertebrate indicator uses an index that relies on ecological traits and classification of organisms into related groups (taxa) such as families or genera. The index combines six different aspects of macroinvertebrate community structure into one score: taxonomic composition, taxonomic diversity, feeding groups, habits/ habitats, taxonomic richness, and pollution tolerance. The measures chosen for each of these aspects vary between ecoregions and are described in the technical support document.
Less than a third, 28%, of U.S. river and stream miles were rated good for benthic macroinvertebrates. The assessment also showed that 25% of river and stream miles were in fair condition and 47% were in poor condition. By ecoregion, good condition ranged from 9% in the Coastal Plains to 61% in the Western Mountains.
No statistically significant changes occurred nationally between 2013-14 and 2018-19. However, a number of statistically significant changes in condition were observed for several survey subpopulations. In the Northern Plains, good condition declined significantly, by 13 percentage points, while in the Western Mountains it increased by 12 percentage points.
Fish Community

Field crew members count and identify fish (such as this sunfish) caught at the site. Most are then released. EPA.
Evaluation of fish diversity and abundance is an important component of water monitoring. Fish are sensitive indicators of physical and chemical habitat degradation, environmental contamination, migration barriers, and overall ecosystem productivity. They need plants, insects, and benthic macroinvertebrates to eat; in-stream and streambank cover for shelter; high-quality streambed substrate conditions for spawning; and overhanging vegetation to shade and cool the water.
To evaluate fish community condition, EPA biologists developed a fish community index using an approach similar to that used to develop the benthic macroinvertebrate index. The index is based on a variety of metrics, including taxonomic richness, taxonomic composition, pollution tolerance, habitat and feeding groups, spawning habits, the number and percentage of taxa that are migratory, and the percentage of taxa that are native. The measures chosen for each of these aspects vary between ecoregions and are described in the technical support document.
As shown below, 35% of U.S. river and stream miles were rated good for the fish community indicator. The assessment also showed that 19% of river and stream miles were in fair condition and 29% were in poor condition. Poor condition ranged from a low of 17% in the Upper Midwest to 50% in the Coastal Plains.
Statistically significant changes occurred nationally in good, fair, and poor condition. Good condition increased by 10.6 percentage points, while poor condition decreased by 10 points. Statistically significant changes in condition were also observed for survey subpopulations.
CHEMICAL INDICATORS
Four chemical indicators were assessed as part of NRSA: nutrients (total phosphorus, total nitrogen), salinity, and acidification. These four indicators were selected because of national or regional interest in the extent to which they might be affecting the quality of the biological communities in rivers and streams. EPA compared sample results either to regional benchmarks developed from a set of reference sites in each ecoregion (for nutrients) or to nationally consistent literature-based benchmarks (for acidification and salinity).
Nutrients
For this assessment, EPA evaluated total phosphorus and total nitrogen, both of which are critical nutrients required for all aquatic life. In appropriate quantities, these nutrients power the primary algal production necessary to support river and stream food webs. Phosphorus and nitrogen are linked; they jointly influence both the concentrations of algae in rivers and streams and the clarity of water. In many rivers and streams, phosphorus is considered the limiting nutrient, meaning that the available quantity of this nutrient controls the pace at which algae are produced. This also means that modest increases in available phosphorus can cause rapid increases in algal growth. The naturally occurring levels of these indicators vary regionally, as does their relationship with turbidity and algal growth. For phosphorus and nitrogen, rivers and streams were assessed relative to NRSA-specific regional benchmarks.

Nutrient levels in parts of the Colorado River have caused extensive algal growth, making the river appear green. Navajo Bridge, Arizona. Mobilus in Mobili. Flickr, CC BY-SA 2.0.
Common sources of excess nutrients include sewage treatment plant discharge, septic systems, fertilizer used on lawns and farms, and animal waste. For more information, see EPA’s nitrogen and phosphorus indicator pages.
More river and stream miles were in poor condition for nitrogen (44%) than in good condition (32%). Good condition ranged from 7% of river and stream miles in the Temperate Plains to 67% in the Western Mountains.
For more details, download the data for this chart, or visit the NLA dashboards for ecoregional data on nitrogen (total).
Phosphorus condition was similar to nitrogen condition, with 42% of river and stream miles rated poor and 36% rated good.
For more details, download the data for this chart, or visit the NLA dashboards for ecoregional data on phosphorus (total).
No statistically significant change was noted for nitrogen nationally between 2013-14 and 2018-19. There were several subpopulations with significant changes in stream condition for total nitrogen. For example, between 2013-14 and 2018-19, results from the Temperate Plains ecoregion indicated a decline in good condition of 11 percentage points.
Nationally, between 2013-14 and 2018-19, the percentage of river and stream miles in good condition for total phosphorus increased significantly, by 16 percentage points, while the percentage of river and stream miles in poor condition decreased significantly, by 17.7 percentage points. As with total nitrogen, statistically significant changes in condition were observed for several survey subpopulations. Of note, seven of the nine ecoregions showed statistically significant improvements in good condition. Future NRSAs will help EPA determine whether such changes are a sustained trend or natural fluctuation.
Acidification

Stream impacted by acid mine drainage from a mid-Atlantic abandoned coal mine. EPA.
Acid rain and acid mine drainage can change the pH of rivers and streams, impacting fish and other aquatic life. High acidity can, for instance, hinder shell formation in mollusks and crustaceans. EPA uses acid-neutralizing capacity (ANC) to indicate sensitivity to changes in pH for the NRSA. ANC is determined by the soil and underlying geology of the surrounding watershed. Rivers and streams with high levels of dissolved bicarbonate ions (e.g., in limestone watersheds) are able to neutralize acid deposition and buffer the effects of acid rain. Conversely, watersheds that are rich in granites and sandstones contain fewer acid-neutralizing ions and have low ANC; these systems have a predisposition to acidification.
Most aquatic organisms function best when pH is 6.5 to 8.5. Sufficient ANC in surface waters will buffer acid rain and prevent pH levels from straying outside this range. In naturally acidic systems, the ANC may be quite low, but the presence of natural organic compounds in the form of dissolved organic carbon (DOC) can mitigate the effects of pH fluctuations.
To classify rivers and streams for acidification, EPA considered ANC measurements along with DOC concentrations. Condition categories used in all ecoregions are defined below:
- Good: Non-acidic sites and naturally acidic sites. Naturally acidic sites include "blackwater" rivers high in tannic acid derived from decaying organic matter. They have low ANC and high DOC.
- Fair: Sites with episodic acidification, which can occur during high-flow events.
- Poor: This category includes sites affected by acid rain and acid mine drainage. These sites have low ANC and low DOC.
Most river and stream miles, 99%, were not acidic based on this indicator. Most of the acidification detected was due to acid mine drainage in the Southern Appalachians ecoregion. Episodic acidification occurred in the Northern Plains and Northern Appalachians.
Nationally, there was no significant change in river and stream condition based on acidification between 2013-14 and 2018-19.
Salinity

The Upper Missouri River Breaks National Monument in Montana. Bob Wick. Flickr, CC BY-NC 2.0.
Salts can be toxic to freshwater plants and animals, and they can make water unsafe for drinking and agriculture. Excess salinity can occur in areas where evaporation is high and water is repeatedly reused for irrigation or water withdrawals; where road de-icing compounds are applied; and where mining, oil drilling, and industrial wastewater are discharged. Conductivity, a measure of water’s ability to pass an electrical current, was used as a measure of salinity for NRSA.
Most river and stream miles, 85%, were in good condition. The assessment also found that 11% of river and stream miles were in fair condition and 4% were in poor condition. The Northern Plains ecoregion had the fewest river and stream miles in good condition at 49%.
Nationally, there was no significant change in stream condition based on salinity between 2013-14 and 2018-19. However, significant changes occurred in some survey subpopulations.
PHYSICAL INDICATORS
The condition of shoreline habitat provides important information relevant to stream biological health. Human activities such as construction, urbanization, agriculture, and removal of vegetation buffers can degrade rivers and streams. NRSA used four indicators of physical habitat condition: in-stream fish habitat, riparian disturbance, riparian vegetation, and excess streambed sediments. Three of these were compared to regionally relevant reference benchmarks, while riparian disturbance was scored using the same method and benchmarks nationally.
In-stream Fish Habitat

Multicolored and speckled rocks help these juvenile Atlantic salmon hide from predators. E. Peter Steenstra, U.S. Fish and Wildlife Service. Flickr.
Healthy fish and macroinvertebrate communities are typically found in rivers and streams that have complex and varied forms of habitat, such as rocks and boulders, undercut banks, overhanging vegetation, brush, and tree roots and logs within the stream banks. NRSA used a habitat complexity measure that reflects the amount of such in-stream fish habitat and concealment features within the water body and its banks.
More than two-thirds of river and stream miles (68%) were rated good for in-stream habitat, while 22% were rated fair and 10% were rated poor. For ecoregions, good condition ranged from 46% in the Northern Appalachians to 85% in the Temperate Plains.
Nationally, the only significant change to in-stream habitat was a decrease (4 percentage points) in the percentage of river and stream miles in poor condition between 2013-14 and 2018-19. Additionally, several significant changes occurred within survey subpopulations. NRSA results indicated statistically significant changes in good condition for three ecoregions: the proportion of miles in good condition increased by 14 percentage points in the Coastal Plains and by 11 percentage points in the Temperate Plains, while the proportion in good condition decreased by 14 percentage points in the Upper Midwest.
Riparian Disturbance

Railroads are one sign of riparian disturbance that field crews check for. Brent Moore. "Vertical lift railroad bridge - Decatur, Alabama." Flickr, CC BY-NC 2.0.
The riparian disturbance indicator reflects the extent and intensity of direct human alteration of the shore itself. These disturbances can range from minor changes, such as the removal of a few trees to develop a picnic area, to major alterations, such as the construction of a large residential complex. Shoreland development can contribute to excess sedimentation, alteration or loss of native plant communities, loss of vegetation structure and complexity, and modifications to river and stream bottom materials. These impacts, in turn, can negatively affect fish, wildlife, and other aquatic communities.
Riparian disturbance was widespread. Nationally, only 36% of riparian areas were rated good (had low levels of human disturbance), 42% were rated fair (moderate levels of disturbance), and 22% were in poor condition (high levels of human disturbance). In the ecoregions, the percentage of river and stream miles in good condition ranged from 5% in the Northern Plains to 55% in the Western Mountains.
For riparian disturbance, there was a significant increase (9 percentage points) in the percentage of river and stream miles rated good, and a significant decrease (5 percentage points) in the percentage of river and stream miles in poor condition between 2013-14 and 2018-19. Additionally, there were several significant changes within survey subpopulations. For example, the proportion of river and stream miles in poor condition in the Southern Plains and Xeric ecoregions increased by 15 and 16 percentage points, respectively, while declining 14 percentage points in the Coastal Plains.
Riparian Vegetation Cover

The banks of this Appalachian stream have healthy understory, midstory, and overstory vegetation. Natalie Auer.
Evaluation of riparian or shoreland vegetation cover is based on observations of three layers of vegetation: understory grasses and forbs, midstory woody and nonwoody shrubs, and overstory trees. Healthy, multilayered vegetation covering this corridor can buffer the effects of human disturbance. Cover can slow runoff; filter nutrients and sediments; reduce streambank erosion; shade water, reducing algae growth; and supply leaf litter, branches, and logs that serve as food and habitat. Generally, riparian habitats are in better condition when vegetation cover is high in all layers; however, not all three layers occur in all areas of the country. For example, Northern Plains rivers and streams typically have less natural overstory tree cover. Such natural differences have been factored into the calculation of the riparian vegetation cover indicator score.
Just over half of rivers and streams (56%) had good levels of riparian vegetation cover; 17% were in fair condition and 27% were in poor condition for riparian cover.
No statistically significant changes occurred between 2013-14 and 2018-19 at the national level, and only one subpopulation showed significant changes. The percentage of river and stream miles in poor condition increased by 11 percentage points in the Northern Appalachians.
Streambed Sediments

Vegetated buffer zones between farmland and streams can help prevent excess sediment loading. Minnesota Pollution Control Agency. All rights reserved.
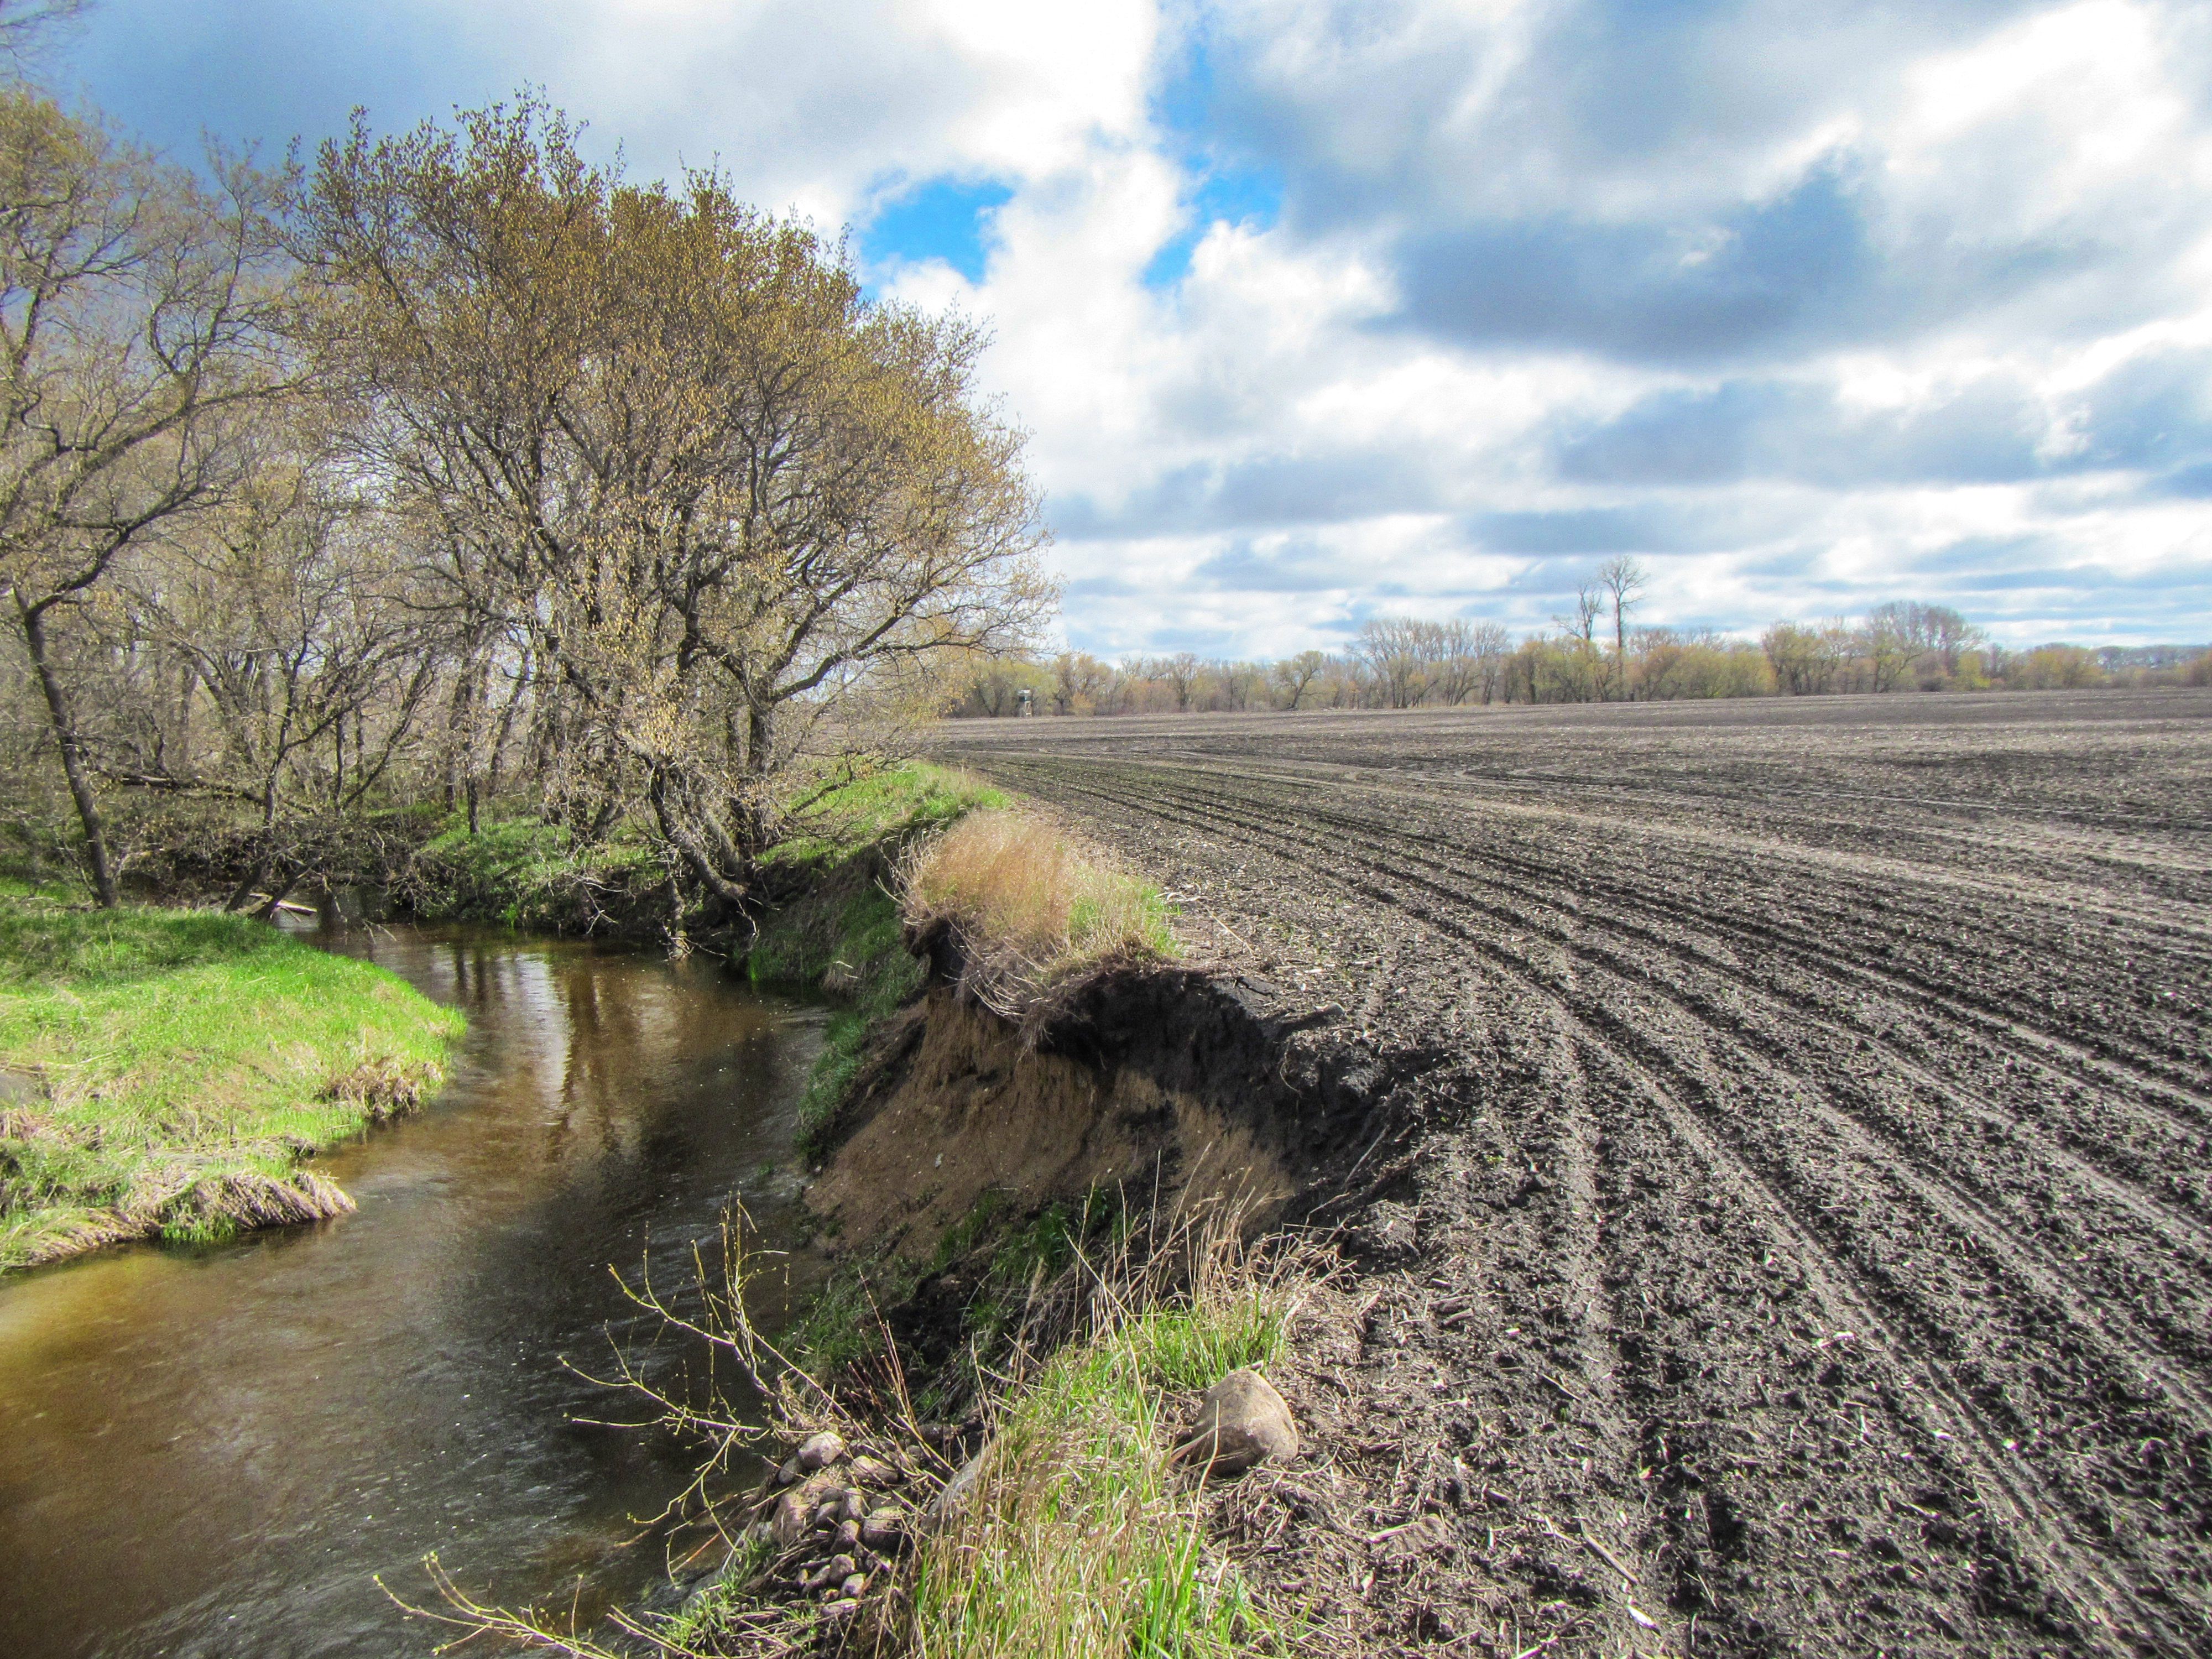
The size mix of particles that make up riverbeds and streambeds is important for maintaining stable and healthy river and stream systems. Human activities that disturb land can interfere with river and stream sediment balance by increasing the amount of fine sediment entering river and stream channels. Human activities can also lead to increases in the magnitude or frequency of flooding. For example, the presence of paved surfaces in a watershed prevents rainwater from soaking into the ground and can increase the volume and velocity of water entering streams and the frequency of high-magnitude floods. In turn, frequent floods can lead to incised and eroded banks, widened channels, scouring of streambeds, washing away of aquatic microhabitats (e.g., woody debris and other organic material), and deposition of fine and less stable sediments (e.g., silt or clay). Excess fine sediments can fill in the spaces between cobbles and rocks where many benthic macroinvertebrates live and breed.
NRSA found that streambed sediments were in good condition in 57% of river and stream miles, were in fair condition in 23% of miles, and in poor condition in 20%.
For streambed sediments, the percentage of river and stream miles in good condition increased significantly (6 percentage points) between 2013-14 and 2018-19. Additionally, significant changes occurred in several survey subpopulations. Results indicated that the Southern Appalachians ecoregion experienced an increase in good condition of 11 percentage points, and the Xeric ecoregion experienced a decrease of 16 percentage points.
Associations Between Stressors and Biological Condition

Sampling equipment. Sarah Lehmann, EPA.
Restoring water quality requires not only an understanding of current condition and change over time, but also of stressors associated with degraded biological condition and the potential for improved conditions when stressors are reduced. This knowledge can help decision makers prioritize stressors for reduction.
To address these questions at the national and regional level, EPA performed three calculations for each stressor, focusing on the benthic macroinvertebrate indicator (presented here) and the fish community indicator (presented in the dashboard) as the indicator of biological condition. Stressors in this case were those measured using the chemical and physical indicators. Note that EPA did not examine associations for human health indicators.
- First, EPA determined the extent of river and stream miles in poor condition for stressors (the relative extent).
- EPA then evaluated the extent to which poor biological condition was more likely when a stressor or indicator was rated poor (the relative risk).
- Lastly, EPA assessed the potential improvement that could be achieved by reducing or eliminating the stressor (the attributable risk).
Highlights of the national results on relative extent, relative risk, and attributable risk for the benthic indicator are described below. Visit the NRSA dashboards to explore risk results for selected survey subpopulations. For more detailed information on these analyses, visit EPA’s NARS risk web page.
The NRSA indicators with the highest national relative extent were nitrogen, phosphorus, and riparian vegetation cover with 44%, 42%, and 27% of river and stream miles in poor condition, respectively. These were the most widespread stressors.
For benthic macroinvertebrates, acidification was the stressor with the highest relative risk estimate nationally (2.1). That is, rivers and streams with acidification in poor condition were 2.1 times more likely to rate poor for benthic macroinvertebrates than waters that weren’t poor for acidification. Phosphorus and nitrogen showed relative risks of 1.7 and 1.5, respectively, indicating rivers and streams rated poor for nutrients were more likely to rate poor for biological condition.
Combining the relative extent and relative risk values for each indicator into a single value provides us with attributable risk. Attributable risk analysis estimates a percentage of river and stream miles for which biological condition could improve (that is, change to either good or fair condition) if the stressor were reduced from poor to fair or good.
Calculating attributable risk involves assumptions, including: 1) that a causal relationship between stressors and biological condition exists; 2) that a river or stream’s poor biological condition would be reversed if the stressor were improved to fair or good levels; and 3) that the stressor’s impact on a river or stream’s biological condition is independent of other stressors. Despite these limitations, attributable risk can provide general guidance as to which stressors might be higher priorities for management nationally or regionally.
Attributable risk analysis shows that reducing nutrients could result in the greatest benefit to biological condition at the national scale, as shown in Exhibit 26. This exhibit shows attributable risk (including point estimates and 95% confidence intervals) for each stressor whose risk is greater than zero. If poor condition were improved to fair or good for nutrients, the percentage of river and stream miles with poor benthic macroinvertebrate condition could be reduced by approximately 20%.
Attributable Risk from Exposure to Stressors Nationally (2018-19)
To see graphs for relative extent, relative risk, and attributable risk together, visit the risk estimate section of the NRSA dashboard.
National Results for Human Health Indicators
In addition to physical, chemical, and biological indicators of the quality of the nation’s rivers and streams, NRSA included data collection for six human health indicators: two algal toxins (microcystins and cylindrospermopsin), the fecal contamination indicator enterococci, and three contaminants in fish tissue (mercury, PCBs, and PFAS).
For algal toxins and enterococci, the results were compared to EPA recommended water quality criteria or benchmarks designed to protect human health against recreational exposure such as swimming or boating. For mercury, the results were compared to EPA’s recommended fish tissue-based water quality criterion for methylmercury. For PCBs and PFOS (the PFAS EPA focused on for this report), EPA derived fish tissue screening levels (described in more detail in the appendix) and compared the fish tissue results to these screening levels.
The results described below provide national- and some regional-scale estimates for these indicators. For information on state-specific and local water quality data and assessments, visit EPA’s How’s My Waterway application. People should check with state, tribal, or local agencies for advisories for swimming, boating, or fishing in specific rivers and streams.
ALGAL TOXINS

Microcystins can cause harm to recreational water users such as kayakers or anglers. Sassafras River, Maryland. Eric Vance, EPA.
Cyanobacteria (sometimes called blue-green algae) are one-celled photosynthetic organisms that normally occur at low levels. Under eutrophic conditions, generally characterized by high nutrients, cyanobacteria can multiply rapidly. Not all cyanobacterial blooms are toxic, but some may release toxins, such as microcystins and cylindrospermopsin. Recreational exposure is typically a result of inhalation, skin contact, or accidental ingestion. Health effects of exposure include skin rashes, eye irritation, respiratory symptoms, gastroenteritis, and in severe cases, liver or kidney failure and death. See EPA’s algal toxins page for more information. Pets are also susceptible to health effects from exposure to algal toxins.
EPA has set recreational freshwater criteria and swimming advisory recommendations for microcystins and cylindrospermopsin: 8 parts per billion (ppb) and 15 ppb, respectively (U.S. EPA 2019). Note that some types of algae release other toxins not monitored as part of the NRSA. The NRSA assesses risk of exposure to microcystins and cylindrospermopsin at national and regional levels. For information about risks at specific locations, recreational water users should check with state, tribal, or local governments.
Microcystins were detected in 9% of river and stream miles but did not exceed EPA’s criterion recommendation of 8 ppb.
For more details, download the data for this chart, or visit the NLA dashboards for ecoregional data on microcystins risk.
Cylindrospermopsin was detected in 10% of river and stream miles and did not exceed EPA’s criterion recommendation of 15 ppb.
For more details, download the data for this chart, or visit the NLA dashboards for ecoregional data on cylindrospermopsin risk.
Microcystin detection decreased significantly, by 29 percentage points, between 2013-14 and 2018-19. No significant change in miles exceeding the recommended criterion occurred between 2013-14 and 2018-19. Note that microcystins were first sampled in 2013-14. Cylindrospermopsin data were not collected in earlier surveys, so no change data are available.
ENTEROCOCCI BACTERIA

Pet waste can wash into storm drains and contaminate waterways with enterococci and other microbes. Dan Keck. Flickr.
Enterococci are bacteria that live in the intestinal tracts of warm-blooded animals, including humans. While not considered harmful to humans, their presence in water indicates that disease-causing microbes may be present. Enterococci are therefore used as indicators of possible fecal contamination from sources such as wastewater treatment plant discharges, leaking septic systems, storm water runoff, pet waste, and farm runoff. For NRSA, water samples were analyzed using a method that measures enterococci DNA (qPCR, or quantitative polymerase chain reaction). Results were compared to an EPA benchmark (1,280 calibrator cell equivalents per 100 milliliters) included in EPA’s recommended recreational criteria document for protecting human health in ambient waters designated for swimming (U.S. EPA 2012).
Enterococci exceeded EPA’s benchmark in 20% of river and stream miles.
Enterococci showed a significant decrease (13 percentage points) in river and stream miles above EPA’s benchmark. Note that enterococci data were first collected in 2013-14.
MERCURY IN FISH TISSUE PLUGS
Contaminants in Fish Tissue
EPA used two sampling approaches to examine levels of contaminants in fish tissue:
- Collection and analysis of mercury in fish tissue plugs.
- Collection of whole fish composite samples and preparation of fillet composite samples for analysis of mercury, PCBs, and PFAS.
This section describes mercury in fish tissue plugs. The other approach is described in more detail in Fish Tissue Contamination in Rivers below.

NRSA field crew member placing a plug of fish tissue into a vial. EPA.
For this study, fish tissue samples were analyzed for mercury. Crews collected small tissue plugs from fillet tissue in target fish species of a minimum size suitable for human consumption. Fish species included bluegill, catfish, northern pike, and smallmouth bass among others; the minimum size was 190 millimeters (7.5 inches). Crews attempted to collect fish tissue plugs at all river and stream sites. The NRSA assessed total mercury levels against EPA’s recommended fish tissue-based methylmercury water quality criterion of 300 ppb (U.S. EPA 2001).
The results for mercury in fish tissue plugs apply to the full NRSA target population of rivers and streams, and, as with most of the other indicators, the portion of the river and stream miles that was not assessed is included in the results. Note that mercury results for fish fillet composite samples described in the next section apply to the sampled population of river miles, and these results should not be directly compared to fish plug mercury results.
Mercury was detected in all fish tissue plug samples. Fish in 5% of river and stream miles (approximately 82,000 miles) had concentrations above the 300 ppb mercury criterion, while 21% did not. It is important to note that 74% of river and stream miles were not assessed primarily due to the absence of fish that met the minimum size requirement. Regionally, high levels of mercury in fish tissue were more common in the Coastal Plains and Southern Plains, where 12% of river and stream miles exceeded the mercury criterion. See the next section for additional information on contaminants in fish tissue.
For mercury in fish tissue plugs, there was no significant difference in river and stream miles with plug concentrations above 300 ppb nationally between 2013-14 and 2018-19. Note that EPA began measuring mercury in fish tissue plugs in 2013-14.
FISH TISSUE CONTAMINATION IN RIVERS
Consuming fish can be an important part of a balanced diet. Fish are low in saturated fat and provide certain essential omega-3 fatty acids that the human body cannot make. Fish can be an important source of protein, especially for communities with high-frequency fish consumers such as subsistence fishers, some recreational fishers, or some fishers in underserved communities. However, contaminants that enter the environment can accumulate in fish. At high enough levels, these accumulated contaminants may contribute to human health impacts such as cancer or neurological problems in people who eat fish. People should consult local fish consumption advisories to determine whether the fish species and quantities of fish they have caught are safe to eat.
As part of NRSA 2018-19, EPA conducted a study of contamination in fish from rivers to determine whether eating river fish poses risks to human health. See the technical support document (U.S. EPA 2024a) for more information on this study, including the rationale for focusing on rivers. The sampling approach for this study involved collecting a whole fish composite sample at each site, from rivers defined as Strahler fifth order or greater. Field crews collected fish species that are commonly caught and consumed by recreational and subsistence fishers.
At the laboratory, the whole fish samples were scaled and filleted, and the fillets were ground. EPA analyzed these fillet composite samples for total mercury, total PCBs (based on the full 209 congener analysis), and 33 PFAS (a list of PFAS is provided in the technical support document). Fillet tissue concentration results were reported on a wet-weight basis.
Note that contaminant results for the fillet composite samples are reported for the sampled population of river miles only; therefore, mercury composite fillet results should not be compared directly to results for the mercury fish tissue plug indicator.
For PCBs, EPA developed screening levels for two types of consumers:
- One for general fish consumers, which is based on a fish consumption rate of one 8-ounce meal of locally caught river fish per week.
- One for high-frequency fish consumers, which is based on a fish consumption rate of four to five 8-ounce meals of locally caught river fish per week.
For PFOS, EPA developed a screening level only for general fish consumers, based again on a fish consumption rate of one 8-ounce meal per week. EPA did not compare the PFOS results to a high-frequency consumption screening level because technical limitations make it impossible in practice to differentiate between exceedances of screening levels for high-frequency and general fish consumers.
These screening levels differ from those used in the 2013-14 report. See the appendix or the technical support document for details on screening level derivation.

For fish tissue contaminant analysis, field crew members attempt to catch fish on a list of targeted species, such as this brook trout. Julia Woods. iNaturalist, CC BY-NC 4.0. Cropped.
Mercury
About 80% of all fish consumption advisories in the United States involve mercury. Most mercury in water comes from air deposition related to coal combustion and waste incineration. Mercury particles, mostly from these sources, fall to land and are washed into rivers and streams. People are exposed to methylmercury (the most toxic form of mercury) primarily by eating fish and shellfish. Fetal or early childhood exposures to mercury transmitted from pregnant and nursing mothers can lead to impaired neurological development, affecting cognitive and fine motor skills. Exposure to unsafe levels of methylmercury can also affect adult health, leading to cardiovascular disease, loss of coordination, muscle weakness, and impaired speech and hearing. EPA applies the conservative assumption that all mercury in fish is methylmercury and therefore measures total mercury in fillet tissue to be most protective of human health.
As with fish plugs, the mercury levels in fillet composite samples were compared to EPA’s recommended fish tissue-based water quality criterion for methylmercury of 300 ppb to identify potential human health risks from consumption of locally caught river fish.
What was the condition in 2018-19?
Mercury was detected in 100% of the 290 fish fillet composite samples analyzed for NRSA 2018-19.
Mercury concentrations in the fish fillet samples exceeded EPA’s recommended criterion of 300 ppb in 26% of the sampled population of 41,099 river miles. See Exhibit 35.
Percentage of River Miles with Fillet Mercury Concentrations Above 300 ppb

Did the condition change?
Comparisons of fillet composite results for mercury between NRSA 2013-14 and NRSA 2018-19 did not reveal statistically significant differences.
Polychlorinated Biphenyls (PCBs)
PCBs accumulate in the tissues of aquatic organisms and are known to cause cancer in animals. Based on those findings and additional evidence from human studies, EPA classifies PCBs as a probable human carcinogen. Other potential human health effects that could result from higher dietary exposure to PCBs include liver disease and reproductive impacts, along with neurological effects in infants and young children. PCBs have been banned for over four decades, but they persist in the environment.
In previous reports, EPA included total PCB results for both cancer and noncancer health effects, based on risk to general fish consumers. However, cancer health effects can occur at lower PCB levels than noncancer health effects, so applying a lower screening level to reduce the risk of cancer health effects also reduces risks of noncancer health effects from dietary exposure to PCBs. EPA’s previously reported results also did not apply to high-frequency fish consumers such as subsistence fishers, some recreational fishers, or some fishers in underserved communities. For this report, EPA used fish tissue screening levels for total PCBs to characterize cancer human health risks for general and high-frequency fish consumers:
- For general fish consumers, EPA applied a 12 ppb cancer screening level for total PCBs in fish tissue.
- For high-frequency fish consumers, EPA applied a 2.8 ppb cancer screening level for total PCBs in fish tissue.
What was the condition in 2018-19?
PCBs were detected in 100% of the 290 fish fillet composite samples analyzed for NRSA 2018-19.
Total PCB concentrations exceeded the cancer screening level of 12 ppb for general fish consumers in 45% of the sampled population of 41,099 river miles. See Exhibit 36.
Percentage of River Miles with Fillet Total PCB Concentrations Above 12 ppb

Total PCB concentrations in the fish fillet composite samples exceeded the cancer screening level of 2.8 ppb for high-frequency fish consumers in 74% of the sampled population of 41,099 river miles. See Exhibit 37.
Percentage of River Miles with Fillet Total PCB Concentrations Above 2.8 ppb

Did the condition change?
Comparisons of fillet composite sample results for total PCBs between NRSA 2013-14 and NRSA 2018-19 did not reveal statistically significant differences in exceedances of the cancer screening levels applied to general fish consumers or to high-frequency fish consumers.
Per- and Polyfluoroalkyl Substances (PFAS)
PFAS are a group of synthetic chemicals used in the manufacture of many products, including non-stick cookware, food packaging, waterproof clothing, and stain-resistant carpeting. PFAS are toxic and persistent in the environment. Most people in the United States have been exposed to PFAS and have PFAS in their blood, especially PFOS and perfluorooctanoic acid (PFOA). Certain PFAS levels have been linked to immune, cardiovascular, hepatic (liver), and developmental health effects such as decreased fertility or low birth weight, as well as an increased risk of certain cancers. PFOS is the most frequently detected PFAS in freshwater fish tissue.
Results for the full set of 33 PFAS included in the fish fillet tissue analyses for NRSA 2018-19 are presented in the technical support document; only PFOS results are described in this section because of the prevalence of PFOS in freshwater fish tissue.
For this report, EPA derived a noncancer fish tissue screening level for PFOS of 0.25 ppb to characterize noncancer human health risks for general fish consumers. Note that although EPA classifies PFOS as likely to be carcinogenic to humans, the agency applied noncancer screening levels for this analysis. Noncancer health effects from PFOS exposure can occur at lower PFOS levels than cancer does, so applying a lower screening level to reduce the risk of noncancer health effects from dietary exposure to PFOS also reduces risks of cancer.
What was the condition in 2018-19?
PFOS was detected at levels above 0.35 ppb in 91% of the 290 fish fillet composite samples analyzed for NRSA 2018-19, corresponding to PFOS being detected in fish in an estimated 92% of the sampled population of 41,099 river miles. Because all detections were at concentrations above the screening level of 0.25 ppb, EPA therefore estimates that fish exceeded the screening level in at least 92% of the sampled population. See Exhibit 38.
Percentage of River Miles with Fillet PFOS Concentrations Above 0.25 ppb

Did the condition change?
Comparisons of fillet composite sample results for PFOS between NRSA 2013-14 and NRSA 2018-19 showed a statistically significant decrease, as much as 7 percentage points, in exceedances of the noncancer screening level for general fish consumers.
Conclusion

Field collection of a water sample. Sarah Lehmann, EPA.
The NRSA provides findings that water resource managers can use to inform resource management priorities and strategies. Nationally, 28% of river and stream miles were in good biological condition, while almost half were in poor condition. The most widespread stressors were excess nitrogen, phosphorus, and riparian vegetation cover, with poor conditions in 44%, 42%, and 27% of river and stream miles, respectively. The NRSA found that the percentage of river and stream miles in poor biological condition could be reduced by 20% if excess nutrient levels could be reduced from poor to good or fair.
While the survey results provide national and regional estimates of condition, they do not address all information needs at all scales. For example, the survey does not measure all stressors and cannot be used to infer local condition. In-depth monitoring and analysis of individual waters and watersheds are required to support specific restoration and protection efforts.
EPA and its state and tribal partners are continually refining the NRSA and will apply lessons learned to determine if changes need to be made to the design, indicators, field methods, laboratory methods, and analysis procedures for the future. Sampling for the fourth NRSA will take place in the summers of 2023 and 2024.
NRSA 2018-19 would not have been possible without the involvement of state and tribal scientists and resource managers. EPA will continue to help these partners translate the expertise gained through these national surveys to their own state-scale surveys. Additionally, EPA will work to encourage use of the data to evaluate the success of efforts to protect and restore water quality.
Other National Aquatic Resource Surveys
In addition to the NRSA, the NARS program also includes the following surveys:
- The National Coastal Condition Assessment (2005, 2010, 2015, and 2020).
- The National Lakes Assessment (2007, 2012, 2017, and 2022).
- The National Wetland Condition Assessment (2011, 2016, and 2021).
Other reports from NARS are available on the NARS home page. EPA will post additional reports and data as they become available.
About This Report
This version of the report was published in September 2024 and includes new results for PFOS exceedances. Earlier versions were published in July and December 2023. Results for other indicators presented in the report and interactive dashboard were last updated 06/07/2023.
Any future corrections or updates will be described in this section.
A suggested citation for the report is: U.S. Environmental Protection Agency. 2024. National Rivers and Streams Assessment: The Third Collaborative Survey. EPA 841-R-22-004. (Revised from December 2023.) U.S. Environmental Protection Agency, Office of Water and Office of Research and Development. https://riverstreamassessment.epa.gov/webreport
References
U.S. Environmental Protection Agency (U.S. EPA). 2001. Water quality criterion for the protection of human health: methylmercury. EPA-823-R-01-001. U.S. Environmental Protection Agency, Office of Water, Washington, DC. https://www.epa.gov/sites/default/files/2020-01/documents/methylmercury-criterion-2001.pdf
U.S. EPA. 2012. Recreational water quality criteria. EPA 820-F-12-058. U.S. Environmental Protection Agency, Office of Water, Washington, DC. https://www.epa.gov/sites/default/files/2015-10/documents/rwqc2012.pdf
U.S. EPA. 2019. Recommended human health recreational ambient water quality criteria or swimming advisories for microcystins and cylindrospermopsin. EPA 822-R-19-001. U.S. Environmental Protection Agency, Office of Water, Washington, DC. https://www.epa.gov/sites/production/files/2019-05/documents/hh-rec-criteria-habs-document-2019.pdf
U.S. EPA. 2024a. National Rivers and Streams Assessment 2018-2019 technical support document. EPA 841-R-22-005. Version 1.1. U.S. Environmental Protection Agency, Office of Water and Office of Research and Development, Washington, DC. https://www.epa.gov/national-aquatic-resource-surveys/national-rivers-and-streams-assessment-2018-19-technical-support
U.S. EPA. 2024b. Final. Human health toxicity assessment for perfluorooctane sulfonic acid (PFOS) and related salts. EPA 815-R-24-007. U.S. Environmental Protection Agency, Office of Water, Office of Science and Technology, Health and Ecological Criteria Division, Washington, DC. https://www.epa.gov/system/files/documents/2024-04/main_final-toxicity-assessment-for-pfos_2024-04-09-refs-formatted_508c.pdf
Appendix: Changes Since 2013-14
Although most aspects of the survey remained the same as in the 2013-14 report, EPA implemented some improvements for this iteration of the survey and report. They include changes to the way survey results are calculated and changes to fish tissue screening levels.
ASSESSING THE TARGET POPULATION
The most comprehensive change to the report was the way the results from the 1,851 sampled sites were used to estimate the condition of a larger population of rivers and streams. For 2018-19, EPA determined it was appropriate to adjust the site weights that are used to calculate condition estimates (percentages) to reflect the full target population of 1,543,290 river and stream miles. In 2013-14, the site weights used to calculate condition estimates reflected the subset of the target population that could be sampled. See the survey design section of the technical support document for further details.
FISH TISSUE SCREENING LEVELS FOR HUMAN HEALTH
PCBs. For NRSA 2018-19, EPA used new fish tissue screening levels for total PCBs for general fish consumers and high-frequency fish consumers.
The general fish consumer screening level was derived using a fish consumption rate of 32 grams/day, which is a nutrition-based recommendation to eat one 8-ounce meal per week, consistent with the U.S. Department of Agriculture and Department of Health and Human Services’ Dietary Guidelines for Americans. This nutrition-based fish consumption rate of 32 grams/day better reflects the role and purpose of fish advisory programs because it does not include data for non-consumers. Previously, to calculate the PCB screening levels for NRSA 2013-14, EPA used the national default fish consumption rate of 22 grams/day (which includes both fish consumers and non-consumers). This fish consumption rate of 22 grams/day is the same fish consumption rate that EPA uses to calculate EPA’s national ambient water quality human health criteria recommendations.
For PCB screening levels for high-frequency fish consumers, EPA applied a fish consumption rate of 142 grams/day (representing four to five 8-ounce meals per week). High-frequency fish consumers include subsistence fishers or others who eat several meals of locally caught river fish per week, including some recreational fishers and some individuals in underserved communities.
Mercury. The fish tissue screening level for mercury remained unchanged from the NRSA 2013-14 report to the 2018-19 report. EPA continues to use the EPA recommended fish tissue-based water quality criterion for methylmercury (U.S. EPA 2001). This human health fish tissue benchmark represents the chemical concentration in fish tissue that, if exceeded, may adversely impact human health.
PFOS. EPA used a human adult body weight default value of 80 kilograms to derive the screening level (increased from the 75-kilogram body weight used in 2013-14) to reflect non-developmental health effects associated with the general adult population. (The screening levels for PCBs already use the 80-kilogram value.) EPA further revised the PFOS screening levels based on new toxicity data. The new screening levels are based on a revised reference dose and cancer slope factor from the toxicity assessment EPA prepared to support new drinking water regulations for PFOS (U.S. EPA 2024b).
For more information on these changes, refer to the human health fish tissue indicator section of the technical support document.
Acknowledgments and Disclaimer
The EPA Office of Water would like to thank the many people who contributed to this project. Without the collaborative efforts and support of the NRSA steering committee, state and tribal environmental agencies, field crews, biologists, taxonomists, laboratory staff, data analysts, program administrators, EPA regional coordinators, statisticians, quality control staff, data management staff, and many reviewers, this assessment of our rivers and streams would not have been possible. To our numerous partners, we express our gratitude.
State, Tribal, Territory and Interstate Partners
- Alabama Department of Environmental Management
- Alaska Department of Environmental Conservation
- Arizona Department of Environmental Quality
- Arizona Game and Fish Department
- Arkansas Department of Environmental Quality
- Bad River Band of Lake Superior Chippewa Indians
- California Department of Fish and Wildlife
- Cheyenne River Sioux Tribes
- Colorado Department of Public Health and Environment
- Confederated Salish and Kootenai
- Connecticut Department of Energy and Environmental Protection
- Crow Tribe
- Delaware Department of Natural Resources and Environmental Control
- Delaware River Basin Commission
- Florida Department of Environmental Protection
- Fort Peck Assiniboine and Sioux Tribal Nations
- Georgia Department of Natural Resources
- Hawaii Department of Health
- Hawaii Division of Aquatic Resources
- Idaho Department of Environmental Quality
- Illinois Environmental Protection Agency
- Indiana Department of Environmental Management
- Iowa Department of Natural Resources
- Kansas Department of Health and Environment
- Kentucky Division of Water
- Leech Lake Band of Chippewa
- Louisiana Department of Environmental Quality
- Maine Department of Environmental Protection
- Maryland Department of Natural Resources
- Massachusetts Department of Environmental Protection
- Michigan Department of Environment, Great Lakes, and Energy
- Minnesota Pollution Control Agency
- Mississippi Department of Environmental Quality
- Missouri Department of Conservation
- Montana Department of Environmental Quality
- Montana Fish, Wildlife and Parks
- Nebraska Department of Environmental Quality
- Nevada Division of Environmental Protection
- New Hampshire Department of Environmental Services
- New Jersey Department of Environmental Protection
- New Mexico Environment Department
- New York Department of Environmental Conservation
- North Carolina Department of Water Quality
- North Dakota Department of Health
- Northern Cheyenne Tribe
- Oglala Sioux Tribe
- Ohio Environmental Protection Agency
- Ohio River Valley Water Sanitation Commission
- Oklahoma Water Resources Board
- Oregon Department of Environmental Quality
- Pennsylvania Department of Environmental Protection
- Red Lake Band of Chippewa
- Rhode Island Department of Environmental Management
- Rosebud Sioux Tribe
- South Carolina Department of Health and Environmental Control
- South Dakota Department of Environment and Natural Resources
- Southern Ute Indian Tribe
- Standing Rock Sioux Tribe
- Susquehanna River Basin Commission
- Tennessee Department of Environment and Conservation
- Texas Commission on Environmental Quality
- Turtle Mountain Band of Chippewa
- Ute Indian Tribe of the Uintah-Ouray Reservation
- Utah Department of Environmental Quality
- Vermont Department of Environmental Conservation
- Virginia Department of Environmental Quality
- Washington State Department of Ecology
- West Virginia Department of Environmental Protection
- White Earth Band
- Wind River Indian Reservation
- Wisconsin Department of Natural Resources
- Wyoming Department of Environmental Quality
Federal Partners
- U.S. Bureau of Land Management
- U.S. Fish and Wildlife Service
- U.S. Forest Service
- U.S. Geological Survey
- National Park Service
- U.S. EPA Office of Research and Development
- U.S. EPA Office of Water
- U.S. EPA Regions 1-10
Additional Collaborators
- Amnis Opes Institute
- Avanti
- Crow Insight
- CSS-Dynamac
- EcoAnalysts Inc.
- EnviroScience Inc.
- General Dynamics Information Technology Inc.
- Great Lakes Environmental Center Inc.
- Midwest Biodiversity Institute
- Moss Landing Marine Laboratories
- Oregon State University
- PG Environmental
- Tetra Tech Inc.
- University of Houston-Clear Lake
- University of Iowa
- University of Kansas, Kansas Biological Survey
Disclaimer. This report provides information on the quality of the nation’s rivers and streams. It does not impose legally binding requirements on EPA, states, tribes, other regulatory authorities, or the regulated community. This document does not confer legal rights or impose legal obligations upon any member of the public. This document does not constitute a regulation, nor does it change or substitute for any Clean Water Act provision or EPA regulation. EPA could update this document as new information becomes available. EPA and its employees do not endorse any products, services, or enterprises. Mention of trade names or commercial products in this document does not constitute an endorsement or recommendation for use.